Extracting Patterns from Genomic Data
Introduction to Time-Dependent Pattern Recognition
When working with complex datasets like the SARS-CoV-2 genome, what initially appears as random noise often contains underlying patterns governed by specific mechanisms. As data professionals, our challenge is to identify these hidden rules that drive modifications in the data. This case study explores how multiple time scales can reveal patterns in genomic data that would otherwise remain obscured in traditional analysis approaches.
The complexity of biological data presents unique challenges for data engineers and analysts. Genomic sequences—essentially long strings of A, C, G, and T nucleotides—contain embedded patterns that evolve over time in response to environmental pressures. Traditional statistical approaches often fail to capture these patterns because they operate under assumptions of stationarity or simple linear relationships.
In this analysis, I will demonstrate how techniques from data engineering, machine learning, and time series analysis can uncover hidden structure in seemingly chaotic genomic modifications. By approaching the problem as a multi-dimensional data challenge rather than purely as a biological one, I've discovered remarkable patterns that follow deterministic rules.
Multi-Scale Time Series Analysis
One of the most fundamental patterns I uncovered is time-dependence, but with an important insight: the choice of time scale significantly impacts pattern visibility. I analyzed the same genome size dataset across three different time scales:
- Standard calendar time - showing dynamic fluctuations
- Sunshine Duration (SD) - approximating daily solar radiation
- Sunspot Number (NS) - tracking solar cycle activity

This multi-scale approach revealed that what appeared as random shrinking in standard time measurements actually followed consistent patterns when mapped to environmental variables. The apparent randomness resulted from the superposition of multiple cyclical patterns operating at different frequencies.
When plotting genome size against standard calendar time, I observed irregular shrinking patterns with no clear periodicity. However, when I transformed the time axis to represent solar radiation metrics (both daily sunshine duration and cyclical sunspot activity), coherent patterns emerged. This demonstrates a critical lesson for data engineers: your choice of coordinate system and time scale can make the difference between seeing noise and seeing signal.
Implementation Details
The data pipeline for this analysis required several key components:
- Data collection layer: Gathering genomic sequences from public repositories and normalizing sequence lengths
- Time series transformation module: Converting between different time scales using astronomical data
- Feature extraction system: Calculating genome size and other relevant metrics
- Correlation analysis engine: Detecting relationships between genomic changes and environmental variables
The superposition of these multiple time-dependent patterns creates what appears to be random behavior when viewed through conventional time measurements. From a data engineering perspective, this highlights the importance of domain knowledge in feature engineering—understanding potential environmental influences guided my choice of time transformations.
Dimensionality Reduction for Pattern Discovery
To analyze the yearly adaptation patterns, I applied a Variational Autoencoder (VAE) to K-mer frequency data. This dimensionality reduction technique allowed me to:
- Organize genomes by latent space coordinates
- Identify sliding patterns in genome fragments
- Discover hotspots for potential mutations
The VAE approach transformed a high-dimensional problem (thousands of K-mer frequencies) into an interpretable latent space where patterns could be visualized and analyzed.

K-mer Representation for Sequence Analysis
For those unfamiliar with genomic analysis, K-mers are subsequences of length K extracted from a longer sequence. For example, the sequence "ACGTACGT" would yield the following 4-mers: "ACGT", "CGTA", "GTAC", "TACG", and "ACGT" (repeating). K-mer frequency analysis is a powerful technique for representing sequence data in a way that's amenable to machine learning.
In the pipeline, I implemented a sliding window approach to extract K-mers of varying lengths (1-4) from each genome, creating frequency vectors that captured the distribution of these subsequences. This transformation converted variable-length genomic sequences into fixed-length feature vectors suitable for deep learning.

VAE Architecture and Implementation
This VAE architecture consisted of several dense layers for both encoder and decoder components, with a latent space dimension experimentally determined to be optimal at 32. This dimensionality provided sufficient capacity to capture genomic variation while constraining the model enough to force meaningful representations.
By training this VAE on our K-mer frequency data, I effectively compressed thousands of dimensions into a manageable latent space where patterns and relationships became apparent. Visualizing this latent space through t-SNE further helped me identify clusters of similar genomes and track evolutionary trajectories over time.
However, ribosome shifting could return the genome to its intended reading frame, preventing early termination. Color coding the “slippery sequence” that signals ribosome shifting results in the following.

However, one of these patterns disappears or is introduced in a few of the selected sequences. Suggesting that the introduction of this pattern into the genome could be a rare but possible event.
Domain-Specific Feature Extraction
From a data engineering perspective, this highlights a critical principle: effective feature engineering requires domain knowledge. While general-purpose techniques like K-mer frequency analysis provide a solid foundation, incorporating domain-specific features dramatically enhances model interpretability and performance.
My feature engineering pipeline included several domain-informed components:
- Slippery sequence detection: I implemented pattern matching algorithms to identify heptameric sequences matching the pattern X_XXY_YYZ (where X, Y, and Z represent nucleotides) known to cause ribosomal frameshifting.
- Open Reading Frame (ORF) analysis: I developed a sliding frame analysis tool that computed potential protein products across all three reading frames, tracking how mutations might alter protein expression.
- Restriction site identification: I mapped recognition sequences for specific restriction enzymes across the genome, creating feature vectors that captured the distribution of these sites.
By visualizing these domain-specific features alongside the latent space representations, I gained insights that would have been impossible with statistical approaches alone. For instance, I discovered that certain regions of the genome maintained consistent restriction site patterns despite mutations elsewhere, suggesting functional constraints on evolution.
Data Visualization for Pattern Discovery
The visualization of these domain-specific features required specialized approaches. I developed a custom visualization pipeline that:
- Mapped genomic sequences to color-coded representations where each nucleotide received a distinct color
- Aligned sequences along specific axes based on latent space coordinates
- Highlighted domain-specific features with overlay markers
- Generated interactive visualizations that allowed for dynamic exploration of the dataset
This visualization approach revealed subtle patterns in how genomic fragments "slide" relative to each other across variants, providing insights into the mechanics of genome reorganization.
Multi-Output Model Architecture
To correlate genomic changes with environmental variables, I modified the model architecture to produce multiple outputs:
- Primary output: Reconstruction of original K-mer data
- Secondary output: Environmental variable prediction (UVB radiation)
This approach allowed us to bind specific genomic patterns to environmental conditions by establishing relationships within the latent dimensions.
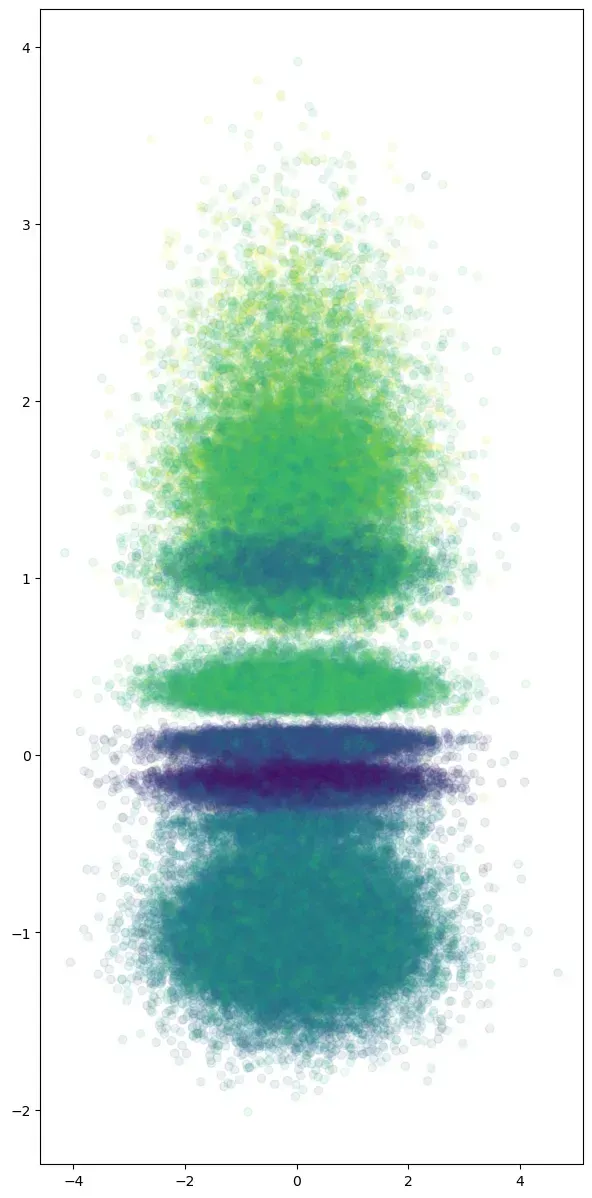
The UVB model shows that learned representation results in a more specific segmentation, as more clusters are obtained. However, the model heavily overfits the training data showing that the specific architecture might not be appropriate for the problem at hand and further optimization is needed to obtain better conclusions. Yet the model still can retrieve some relationship between the genome and the environmental data.

Interpretability Through Feature Correlation
By correlating specific K-mer patterns with UVB radiation levels, I created interpretable connections between genomic features and environmental variables. Each pattern approximated a yearly dynamical signature, providing actionable insights for potential applications.
I later expanded this to include atmospheric composition data, allowing the model to differentiate between direct solar radiation effects and atmospheric influences.

The model overfits its training data, but some patterns emerge from the analysis. The model can differentiate between solar radiation data and atmospheric composition.

Further optimization of the different models will enable better understanding of how the viral genome adapts to the environment; as well as identifying recurrent mutational patterns and how they affect the genome. Identification of recurrent patterns will fast-track the development of new treatments as well as the design of seasonal or general vaccines. And while most of the analysis is done using SARS Cov2 genomic data, different parts of the analysis can likely be repurposed for other viruses particularly non-fragmented ones.

Differential Response to Solar vs. Atmospheric Variables
One of my most intriguing findings was that the multi-output model learned to differentiate between direct solar radiation effects and those mediated by atmospheric composition. The model developed distinct latent space representations for these different influences.
Certain regions of the latent space corresponded to specific atmospheric conditions, while others were more responsive to direct solar radiation metrics. This finding has profound implications for understanding how different environmental factors drive genomic adaptation.
Actionable Insights from Atmospheric Analysis
The integration of atmospheric composition data yielded several actionable insights:
- Differential susceptibility: I identified specific genomic regions more susceptible to atmospheric-mediated vs. direct solar effects.
- Predictive signatures: By analyzing the latent space, I could predict which K-mer patterns would be more prevalent under specific atmospheric conditions.
- Geographic implications: The model revealed how genomic adaptation might vary across different geographic regions with similar solar exposure but different atmospheric compositions.
These findings demonstrate the value of a comprehensive data engineering approach that integrates multiple data sources and uses sophisticated modeling techniques to uncover hidden relationships. As always the code for this post can be found by clicking here.


