COVID 19 Adaptability: A Review of Analytical Methods
A virus is a biological agent that can only replicate inside a host. The host can be either a cell inside a multicellular organism or a single cell of a unicellular organism. By a series of mechanisms, the virus hijacks the molecular machinery inside the cell to replicate itself. Specifics of how the virus can hijack the cellular machinery will depend on the virus itself. Even so, the main strategy is to mimic cellular components. Tricking the cell into thinking that it’s doing its regular job.
Viruses consist mostly of two components, nucleic acids(DNA, RNA) and proteins. The nucleic acids contain the information needed to synthesize the components of a new viral particle(proteins). And the viral particle contains structural and non-structural elements. Structural elements make up the main body of the virus they protect the nucleic acids and aid in the entry into the host cell. While non-structural elements aid in hijacking the molecular machinery of the host cell.
Once the virus hijacks the machinery it manipulates them to make copies of the virus and release them into the extracellular space. This allows the virus to extend into different hosts, in the case of a unicellular host. Or to disseminate to other cell types and through the entire host in the case of a multicellular host. Eventually, the virus will escape and infect another susceptible host, and the cycle repeats. The release of viral particles often results in the destruction or lysis of the cell. Resulting in the death of a unicellular organism, or illness and disease in the case of a multicellular organism.
Why the emergency?
Because of their simplicity viruses can spread through different hosts with ease and cause illness and disease. The nature of the disease caused by the virus and its transmissibility will depend on the virus itself. However, sustained transmission within a human population raises the alarm of a virus with probable pandemic potential.
Viruses that could pose a threat to society due to their epidemic potential are included in a list curated by the world health organization. The list contains a subset of known viruses and it aims to prioritize research into highly pathogenic viruses. Furthermore, the list also includes an X disease, referring to an unknown pathogen. The last prioritization exercise was conducted in 2018 according to the WHO and include viruses such as Ebola, SARS, and MERS among others.
The first cases of COVID-19 were diagnosed in the People’s Republic of China in Wuhan the capital province of Hubei on December 2019. On the 7 of January 2020, the full sequence of a virus isolated from a patient was already available on different databases. By, January 30 WHO declares a Public Health Emergency of International Concern due to its rapid spread. And finally, on march 11 WHO declares a pandemic emergency.
In a couple of months, COVID-19 traveled across different countries and populations. Increases in the number of cases also increase the chance for the virus to adapt to the new host. These two features, cases, and adaptation are the two main sources of information during this pandemic. Cases in the form of case counting and adaptation in the form of genetic surveillance. The following describes a series of analyses that can be applied to cases and sequence data sources. It could also be seen as a draft or a blueprint to apply to other outbreaks driven by viruses. Or as a method to analyze endemic diseases through genomic surveillance.
Cases and time scales
Raise in cases in different countries resulted in the development of a series of data dashboards. With the intent to understand the course of the pandemic. One of the main metrics was the pandemic peak. The pandemic peak refers to a particular day when the number of cases reaches the largest value followed by a continuous decline. The rise and fall in the number of cases resulted in a pandemic wave. Several waves have been reported with a space between peaks of around six months.
However, by grouping the data by latitude a series of pandemic peaks appear to be shifted by a couple of days. This specific phenomenon can be seen in the northern hemisphere, while in the southern hemisphere is hard to tell. Nonetheless, a geographical dependence on pandemic peaks has been present in the news and other information sources. News of a new pandemic wave from a country at a different latitude continues to be a common recurrent theme.
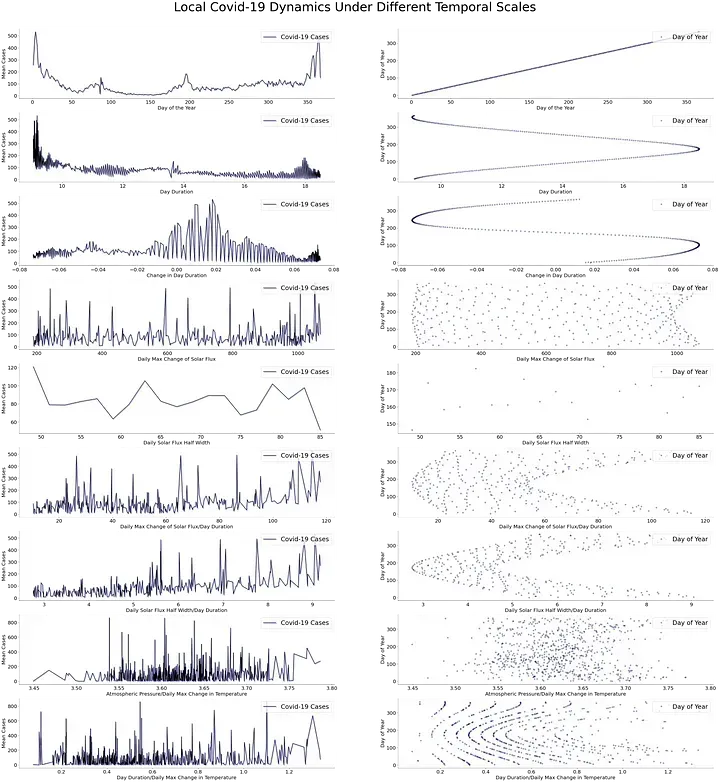
Different environmental variables can change latitude-wise. But one that happens around every six months is the shift in sunshine duration. From the end of the year to around half of the year, the sunshine duration increases. While during the second half the sunshine duration decreases. These continuous changes create two stationary points of maximal and minimal sunshine. Using the sunshine duration as a measure of time results in the clustering of COVID-19 cases near the stationary points.

Dependence on solar features can be further investigated by the approximation of the solar flux. The solar flux represents the amount of solar radiation that reaches a particular location throughout the day. Using custom solar features as a measure of time results in a series of COVID-19 waves of less duration. Changes in daily solar flux could reflect temperature changes. Custom solar and temperature features also cluster the cases into periods with a high number of cases.
The number of cases and solar-related features appear to have some relation between them. Changes in solar radiation through time are known as the solar cycle. The solar cycle has an approximate duration of eleven years and is characterized by changes in solar activity. These changes increase or decrease the amount of solar radiation that reaches the planet. Other examples of changes in the amount of solar radiation are the yearly changes in sunshine duration and the daily changes in sunlight. The term solar cycle will be then used to encapsulate all the previous phenomena. If there’s a relationship between the solar cycle and COVID-19. Other aspects of the disease should be correlated to different frequencies of the solar cycle.
Detection efficiency is also affected by the solar cycle. McNaughton reported a peak efficiency in SARS-Cov2 PCR detection around the middle of the day. The authors of the paper raised the importance of such timing as it could impact public health measures. Also, a small report from India by Baruah shows an increase in the mortality of COVID-19 patients around noon. The authors also noted the small sample size and the inability to get an accurate conclusion from the data. Yet, official information obtained from death certificates from Mexico shows some synchronization. Around 20% of official COVID-19 deaths in 2020 happened near noon. Moreover, the time of death appears to synchronize with times near noon.

Yearly and daily components of the solar cycle show some correlation to periods with high susceptibility to COVID-19. On a greater time scale, a rapid increase in cases of COVID-19 happened at a low level of solar activity. The 25th solar cycle started around 2020 with a minimum of solar activity. The omicron variant with the alleged hallmark of generating “mild disease” was detected in South Africa in November 2021. Solar cycle estimation shows that by November 2021 solar activity entered a period of linear increase. A characteristic shared with low COVID-19 cases on the yearly solar scale. Changes in solar activity could be an indirect measure of susceptibility to COVID-19. Changes inside the host that correlate with solar activity could ease the infection process through an unknown mechanism.
Dependence on different frequency components of the solar cycle can lead to practical advice. Avoidance of large crowds or closed spaces at times near stationary points in the yearly solar cycle could lower the odds to get infected. While on the daily solar cycle, nighttime activities might be safer compared to daytime activities. Corroboration of the previous recommendations can be obtained by measuring viral load and viral shedding throughout the day. This could also help to develop more effective treatments. If the virus follows a specific schedule for its synthesis, then the timing of antiviral treatment can be optimized to get the best benefits from it.
Changes in susceptibility through the year can also help to make better long-term assessments of vaccine efficiency or natural immunity. A better comparison will result from comparing data with similar levels of susceptibility.
Sequences and how to represent them
Rapid isolation and sequencing of SARS-Cov2 lead to a particular discovery, the fast adaptation of SARS-Cov2. This started the continuous surveillance of SARS-Cov2 and the detection of different variants. However, working with SARS-Cov2 sequences in large numbers is a challenging task. The average SARS-Cov2 genome size is around 30000 bases. And as the number of isolated sequences grew the number of comparisons grew at a faster rate.
Analysis of biological sequences relies mostly on pairwise sequence alignment and multiple sequence alignments. Multiple sequence alignment is an NP-hard problem. Due to the complexity, many heuristics have been developed to find an approximate solution. Nonetheless, the rising number of sequences restrained the ability to perform large analyses. Particularly due to the need for vast amounts of computational resources.
Computationally sequences can be represented as a continuous string, where each letter represents a single nucleotide. This simple representation is the most widely used to share biological sequences. Another form to represent sequences is by defining an encoding. One hot encoding is a popular technique to encode categorical information in data science. Biological sequences can be encoded into a series of vectors with the same size as the number of nucleotides. A one represents a particular nucleotide, while the remaining elements are zero. This encoding will result in a 2D array of size (4xsequence size).
The use of one hot encoding to analyze SARS-Cov2 sequences has already been used to train a machine-learning model to classify new variants. Classification of SARS Cov2 pangolin lineages uses one hot encoded sequences. Representation of sequences as a continuous string or by one hot encoding preserves the structure and order of the sequence. That characteristic makes them the most used representations of sequences.
A compressed sequence representation can also be obtained by splitting the sequence into a series of fragments. Then the frequency of each of those fragments is calculated and used as a small-size representation of the sequence. To extract as much variability as possible the sequence is fragmented in a sliding manner. Where each k-size fragment overlaps the next fragment by k-1 characters or nucleotides.
Stacking the different fragments from K=1 to k=5 results in a series of high-dimensional datasets. Pairwise comparisons can be done from these datasets. But the number of comparisons increases with the number of samples. To easily look for patterns inside the data a dimensionality reduction technique is applied to the dataset. This results in a low-dimensional dataset that can be easily analyzed to look for patterns. Applying a common dimensionality reduction technique like PCA to the dataset results in a series of clusters.

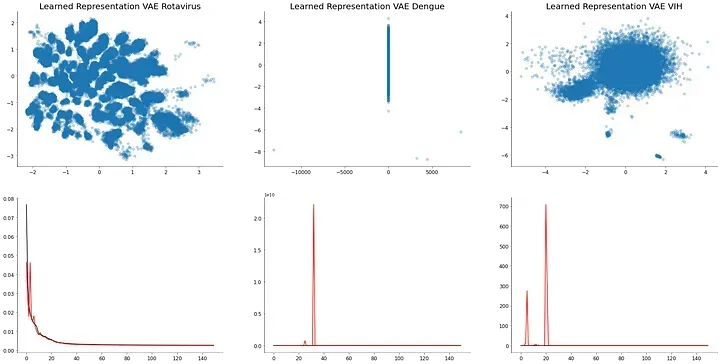
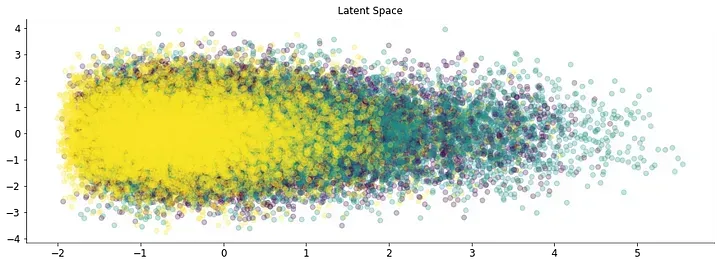
This simple observation points towards a particular pattern inside the SARS-Cov2 sequences. But, PCA projection results in the loss of almost all the variability inside the original dataset. Variational autoencoders (VAEs) are deep learning models that also perform dimensionality reduction. The additional characteristic is that the low dimensional space contains a learned representation whose axis represents a pattern inside the data. VAEs are also generative models and can reconstruct the original dataset. Thus the model can predict changes in the frequency of fragments.

Trained VAEs resulted in the clustering of SARS-Cov2 sequences. The similarity in color points towards a time-wise pattern inside of the data. And the ability of the VAE to retrieve temporal information is independent of the isolation year.

Traditional time series techniques cal also obtain temporal patterns from fragment frequency data. Seasonal and trend components can be retrieved by calculating the moving average of the frequency data over time. Although the match is not perfect it does point towards a fixed upward direction in the case of some nucleotides or nucleotide combinations. This particular characteristic can aid the design of either seasonal treatments or plan for a long-term treatment strategy. As the amount of a nucleotide increases in the sequence, it will result in a greater susceptibility to specific nucleotide analogs. In the early days of the pandemic the use of remdesivir, an adenine analog, was put into question several times Jiang et al. While current reports show a better picture for remdesivir treatment Gottlieb et al. Seasonal and trend components inside adenine content could explain such discrepancies.

Furthermore, small fragments can also be used to classify SARS-Cov2 lineages. The top 30 most reported variants can be classified with fragment frequency information with around 95% accuracy. This small model can offer an alternative for variant classification. And can be easily scalable to an even larger number of sequences and variants.

Changes in fragments frequency can also point toward mutational hot spots. Periods where SARS-Cov2 genome composition moves from one cluster to another. As the number of new variants isolated near those transition points increases. Determination of those transition points at different geographical regions could help to establish public health measures or for personal risk assessment.

Even with the different patterns that can be found inside the sequence by just fragment frequency, the specific location and impact of the different changes inside the SARS-Cov2 genome are lost. Thus specific changes in amino acids and immune evasion cannot be addressed by fragment frequency at the moment. However, the overlapping fragmentation resembles a De Bruijn graph, a kind of graph used for genome assembly. Extending the graph idea, by sub-fragmentation of the original fragments leads to a collection of graphs that make the sequence. The overlap in the sub-fragmentation yields a series of graphs that encode the sequence by connections rather than nodes.

If the sequence is fragmented into 4-size elements and a sub-fragmentation of 2-size sub-fragments without overlaps, then there are 16 different combinations of nucleotides. This graph can be represented as an adjacency matrix leading to a 16x16 array. Then the sequence is fragmented into 16 non-overlapping fragments leading to a 16x16x16 array. This new encoding captures a part of the location information and allows the information to be closer by expanding the number of dimensions of the encoding.

VAEs trained with the new encoding resulted in the retrieval of a similar temporal pattern. But it also found the predominant location of such changes. Particularly SARS-Cov2 genomic region coding for structural elements contains the most information regarding temporal adaptation.
This alternative encoding technique also shows that expanding the dimensions of the encoding can be a more efficient data structure. As this dimensional expansion brings closer different fragments that are far away. Testing this idea the full SARS-Cov2 sequence is one hot encoded and reshaped into a 32x32x32x4 array.

Ordering the samples by different time measures result in a pattern that appears to be cyclical under the larger time scale. Solar features did not show a meaningful kind of pattern but the number of days since the Wuhan outbreak shows some order. This specific order might hint that the SARS-Cov2 genome is reverting towards an arrangement like the ancestral strain. If this trend is correct might explain the disappearance of pandemic diseases. Reversion to an already known pathogen, either infection or vaccination immunity, will result in a more efficient removal by the host.

Confidence in full-length sequence prediction lowers as the sequence approaches more variable regions. Low probabilities show that the model is not able to confidently predict the most likely nucleotide. This could be due to poor model performance or the need for additional information to increase precision. Expanding the dimensionality of the encoding could help to bring closer together different sequence regions that are far away. Or could also mimic the 3D structure of the genome making it easier for the network to understand the data.
Why does this happen?
The ability to find a series of fixed patterns inside the different sequence encoding shows that adaptation inside the SARS-Cov2 genome follows a deterministic mechanism. And random mutations should be minimal or result in minimal changes in the genome. Moreover, the environmental conditions that follow also show a deterministic pattern.
Proposing a mechanism that could bring together the host-virus interaction into a plausible molecular mechanism will provide information to design better treatments. Yet the virus-host interaction is not the only factor involved.
The host and the virus
One possibility of the fast spread of SARS-Cov2 is due to high susceptibility derived from changes in the solar cycle. Fast spread of SARS-Cov2 aligns with low solar activity in 2019–2020. NASA data also shows minimum radiation at biologically relevant wavelengths. If changes in solar activity are correlated to susceptibility to respiratory diseases, then different outbreaks could also follow solar activity. Historical records show that outbreaks of respiratory diseases occur near stationary points in the solar cycle.

Susceptibility points towards faulty or poor immunological response driven by environmental conditions. How the environment and specifically solar radiation can influence the immune system? Is anyone guess. But, biologically relevant wavelengths are also used to detect and quantify DNA/RNA or proteins, the main components of viruses, in lab applications. Thus if the host has some sort of detection mechanism that relies on specific wavelengths for the detection of pathogenic organisms, it will struggle in conditions with low and high radiation.

Another possibility is a resource-constrained approach. Upon infection one of the first reactions by the host is the degradation of nucleotides. This will lower the number of resources available for the virus and lower the number of viral particles synthesized.

Specific environmental conditions upregulate a series of genes with a similar nucleotide content as SARS-Cov2. This will ensure the nucleotide resources for RNA synthesis, but also the amino acids for protein synthesis. For such a mechanism to be possible SARS-Cov2 will need to sense the available genes or nucleotides inside the cell. One possibility could be to use the RNA structure itself as a logical gate as secondary structures inside DNA or RNA can behave logically. Hybridization between RNA regions and small fragments of RNA will open or linearize the RNA. The combination of the different hybridization fragments can result in an if-and-only-if behavior, where RNA is linearized only when all the fragments are available.
Hybridization between the SARS-Cov2 genome and mRNA or mRNA fragments from the host could work as a gene detection system. It could also be responsible for the development of autoimmunity. The selection of fragments with a better match between viral and host RNAs will yield the selection of highly similar RNA. Viral proteins in turn will have fragments with high similarity to the host.

Comparison between the reference genome and the SARS-Cov2 sequence results in the retrieval of a series of genes with composition similarity to SARS-Cov2. Particularly a subset of genes involved in the Vitamin D pathway. A Vitamin synthesized by solar radiation and low levels is correlated to COVID-19 severe disease. If a long-term starvation strategy is used by the host, then highly similar genes could be downregulated, leading to a wide range of secondary effects.
Each mechanism cannot exclude the other one and a combination of both mechanisms could also be plausible. If SARS-Cov2 can infect at conditions with high susceptibility to the host, then it will adapt to better identify such conditions.
What about the environment?
Another option could be due to an external worldwide factor. Small changes in the temperature can pass relatively unnoticed to us, but as the scale goes down the impact could be catastrophic. For example, the length of a degree in latitude on the surface of the earth is around 100 km, and this distance is even higher for satellites or the international space station.
Changes in the environment of the microscopic world could already bring to extinction the natural predators of viruses. A series of microorganisms with whom we have a symbiotic relationship that we were not even aware. Also, other non-host organisms have been identified to be able to remove viruses, in marine ecosystems sponges have an important role in virus removal. Other organisms could have a similar role in other ecosystems. Urbanization removes most of the natural environment and those organisms in charge of removing viruses are gone. Increasing the overall viral load in urban environments.
Environmental changes could also have a small impact on the way the immune system works. As it relies on well-defined environmental patterns to be fully competent. Molecular cues used to measure time might start to shift between them. Malleability within the immune system can carry on and adapt, but cracks might be showing up. Pathogens passing through those gaps might be a reason why herd immunity is not being achieved even at high rates of infection.
Final remarks
Some background
The previous is an attempt to provide a comprehensive and logical analysis of two of the most common phenomena through the COVID-19 pandemic. The rise and fall of COVID-19 cases and the discovery of the different variants through time. How the different ideas were found or proposed is different from the order in the post. Sequence analysis was the primary driver, and you can see how time-wise the analysis was evolving and other pieces of information were added in the different COVID-19-related posts.
The main findings can be summarized in two, an environmental correlation and a sort of molecular clock inside the viral sequence. Although the accuracy of full sequence prediction remains low current computational resources restrain the kind of search that I’m able to do. Nevertheless, all the analysis can be done with somewhat minimal resources. This will enable the use and customization of such models to local conditions. Likely, variants could also be geographically constrained, meaning that specific SARS-Cov2 genome rearrangements could be specific to certain locations.
Even with a large number of sequences, most of the data is from the USA and could not reflect the full range of possible SARS Cov2 sub-variants. Also, possible data leakages are likely to occur, without prior knowledge of the molecular clock it is unlikely to be able to address probable leakages. If two sequences with equal patterns are isolated at a couple of days of difference and end in the train validation dataset respectively it could lower the validation loss. This could give a false sense of generalization.
The main method used to prevent data leakage was to shuffle the different ids and check if in the different folds the individual batches ended up sorted by the day of the year. No such leakage was found. Also ordering the sequencers by the days from the outbreak results in a similar temporal pattern.
Other applications
Small fragment frequency or k-mers is the analogous model to the n-gram model and currently has been used as a method to encode large sequences. From those encodings, seasonality and variant classification are one of the applications. But those might not be the only ones.
Mean SARS-Cov2 composition, trough sunshine duration as a measure of time, remains fairly constant. Sunshine duration might work as a control variable for SARS-Cov2 genome adaptation. Mechanisms inside the virus could measure the current time and then adapt how the sequence should be constructed. The SARS-Cov2 genome might sense the available fragments at the current time. The other viral components measure the discrepancies between the resources and the genome. This information is then passed to the component that synthesizes the final genome. Such a mechanism will ensure the generation of genomes with a better adaptation to the host. Applying control theory to analyze the different components inside SARS-Cov2 can help us to better understand how all the different parts work together.

Genomic surveillance sequences can also be independent snapshots of different disease states. Then genomic surveillance is a series of snapshots of how the disease progress in the upper respiratory tract. The VAE architecture can be modified to retrieve also a dynamical system that describes the interaction.

The dynamical VAE can retrieve a dynamical system with a transitory phase with a similar duration as the incubation period. This does not mean that the course of the disease could only be the one from the model as only represents the infection in a single tissue/system. But it shows that models can be extended to other tasks. The extension of the different encodings to other tasks could help to improve pandemic preparedness. Also, the application of computational approaches to the study of viral diseases could remove or lower the amount of wet lab experimentation. Adding a new layer of security before performing dangerous experiments.
Unsupervised clustering can also be applied to different viruses. Particularly the use of small fragment frequency appears to be more effective with single-strand viruses. While viruses with fragmented genomes such as influenza viruses result in a single cluster. However, is hard to determine if there’s a temporal pattern inside the sequences as most of the metadata is lost.

The use of small fragment frequencies can also be applied to experimental data. Particularly single-cell expression data. The matrix multiplication between the gene counts and the fragment frequencies of each gene in the experiment will result in a relative quantification of the number of fragments in the cell. Application of this technique to the data from “Open Problems — Multimodal Single-Cell Integration” shows that cell results are being ordered by the observation day.
Also, a non-perfect match is obtained for immune cell classification from data obtained from the immune cells census dataset. Application to other single-cell data sets results in the generation of several clusters with no clear meaning. Hence this technique might not be appropriate for single-cell data or the number of measured genes is not enough to describe the cell. Also, sequences are obtained from the reference genome and SNPs exclusive to each sample could also change the fragment frequency.

Susceptibility and adaptation
The use of susceptibility for data regarding cases refers to a condition within the host that eases the infection process. Susceptibility can be a baseline for the risk of infection and can increase due to specific host conditions. Host behavior can increase susceptibility by engaging in an unhealthy lifestyle but it cannot lower it below the baseline.
Adaptation in the case of sequence data refers to how the virus adapts its sequence to match the host conditions. While evolution reflects more like a long-term goal and more information is needed to accurately understand the goal. The average course of a COVID-19 infection is around 5 days leading to 12 generations of viruses or 300 human years. That’s more time than the oldest democracy in the world. Thus planning for a more benign habitation of the host seems far-fetched. Nevertheless, I do think that is more plausible that old SARS-Cov2 complains that millennial SARS-Cov2 eats too many avocado toasts.
Perceived viral attenuation could be the result of a resource crisis (Nucleotides, amino acids, energy). Cells and tissues express a subset of genes specific to their function. This leads to a selection of codons by the host a phenomenon known as codon usage bias. The virus mimics the host genomic components by modifying its genome to match the codon bias of the target cells. Those changes increase the infectivity of the virus and are silent to protein-based surveillance. Codon bias optimization aims to generate protein synonym sequences and to find a better match to the available resources. The process will be faster and more efficient and also the resources will be consumed at a faster rate.
Fast resource consumption could deplete cellular resources leaving unfinished the assembly of viral particles or genome replication. The hijacking of molecular machinery by the infection process can also shut down other “garbage collection” processes. Fast resource consumption generates waste at a high rate and eventually shuts down essential processes, triggers apoptosis, or creates other kinds of problems.
What about long covid?
Viral persistence could trigger a long-term starvation strategy and the heterogenicity of the different symptoms might be due to different genes being down regulated. Persistence will also lead to viruses better adapted to the host and copying specific fragments more efficiently leading to autoimmunity. As the host becomes a viral factory high amounts of pyrophosphate are produced due to RNA and protein synthesis. High phosphate could trigger the formation of clots and lower the amount of ATP. Physical activity and exercise will increase pyrophosphate levels returning to a toxic level leading to exercise intolerance. Low levels of ATP could also lower adenine levels altering the circadian signaling of adenine such as blood pressure control and the need for sleep.
Although it’s not exhaustive, the previous hypothesis is a good draft to start to work on different mechanistic explanations of post-infection sequelae.
As always the complete code for the series of analyses can be found on my GitHub by clicking here.